Nvidia Posts Another Blowout Quarter. What Can Slow It Down?Hint: Not much.
🚀 Earnings So Good You Can’t Ignore ‘Em
Another quarter, another jaw-dropper from Nvidia NVDA . In what has basically become a quarterly ritual at this point (congrats to all who celebrate!), Jensen Huang’s silicon empire posted revenue of $44.1 billion , soaring past the $43.

The best trades require research, then commitment.
Get started for free$0 forever, no credit card needed

Scott "Kidd" PoteetThe unlikely astronaut

Where the world does markets
Join 100 million traders and investors taking the future into their own hands.

Gold long again: Completion of Double CombinationYesterday's long gold idea was invalidated and turns out that Gold has decided to do a double combination instead of a single A-B-C correction.
Now that I've seen a completion of a Double Combination, I think it is time to try to long gold again.
The stop is below $3240.

Is Bitcoin Ready for Its Next Leg Up? Here’s What We Know So FarBitcoin BITSTAMP:BTCUSD is so back — not just back like “we recovered the dip,” but back like “new all-time highs, let’s go shopping for Lambos on moons” back.
If you’ve been following our Top Stories coverage, you’ll know that the OG token vaulted past $109,500 last week, then kissed $11

USDJPY – Diverging Policies Drive Yen into Pressure Zone near 14USDJPY – Diverging Policies Drive Yen into Pressure Zone near 144
🌍 Macro Landscape: JPY Stuck Between Two Diverging Forces
In recent weeks, the US dollar has regained strength as the Federal Reserve remains committed to its "higher-for-longer" interest rate stance. On the flip side, the Bank of Jap

Trump Delays Tariffs, but Trade Tensions with EU Are Heating UpDonald Trump is back in headline mode — and this time, the EU is in his crosshairs.
After weeks of relative calm, the US President reignited global trade tensions by announcing a 50% tariff on all EU imports. But in a surprise twist — and in true reality-TV fashion — he’s now pushed the start date

SMR NNE OKLO – Breakout Setup Triggered by Nuclear CatalystNYSE:SMR is lighting up after Trump’s announcement on nuclear energy — and it’s not alone. NYSE:OKLO and NASDAQ:NNE are also setting up, but NYSE:SMR has one of the cleanest breakout structures on the board.
🔹 Catalyst: Trump’s nuclear energy announcement yesterday is putting serious momentu

GOLD Price Analysis: Key Insights for Next Week Trading DecisionGold prices surged last week, ending with a strong 3.9% weekly gain, closing around the $3,365 zone after bouncing back with conviction on Friday. In this video, I break down why gold rallied, what key events influenced price action, and how I’m reading the current chart structure to strategically p

Gold at a Crossroads: Key Resistance Levels in FocusFrom the Trading Desk of InvestmentLive:
Gold has struggled to sustain any meaningful downward momentum, despite our broader bearish bias on the yellow metal. After a sharp decline the week before, last week saw gold stage an even stronger recovery, pushing higher and regaining lost ground.
Howeve

Week of 5/25/25: EU AnalysisExtremely bullish last week leads to my bias being long this week until the weak daily structure is broken.
Thanks for coming, goodluck this week!
Major News:
PMI - Thursday

Quick updateSP500 and Gold both consolidating, not much action but I think we may see some movement overnight

See all editors' picks ideas
EMD Trend [InvestorUnknown]EMD Trend is a dynamic trend-following indicator that utilizes Exponential Moving Deviation (EMD) to build adaptive channels around a selected moving average. Designed for traders who value responsive trend signals with built-in volatility sensitivity, this tool highlights directional bias, market

Bear Market Probability Model# Bear Market Probability Model: A Multi-Factor Risk Assessment Framework
The Bear Market Probability Model represents a comprehensive quantitative framework for assessing systemic market risk through the integration of 13 distinct risk factors across four analytical categories: macroeconomic indic

Range Filter [DW]This is an experimental study designed to filter out minor price action for a clearer view of trends.
Inspired by the QQE's volatility filter, this filter applies the process directly to price rather than to a smoothed RSI.
First, a smooth average price range is calculated for the basis of the fil

Delta Volume Columns Pro [LucF]█ OVERVIEW
This indicator displays volume delta information calculated with intrabar inspection on historical bars, and feed updates when running in realtime. It is designed to run in a pane and can display either stacked buy/sell volume columns or a signal line which can be calculated and dis

BERLIN CandlesA problem with Heikin Ashi is that while it gives you a great overview of overall direction, it is rarely possible to use it as a replacement for normal japanese
candlesticks. The reason for this is that actual price data is lost, since the candles are more akin to a moving average than a different

Support Resistance ChannelsHello All,
For Long time I was planning to make Support/Resistance Channels script, finally I had time and here it is.
How this script works?
- it finds and keeps Pivot Points
- when it found a new Pivot Point it clears older S/R channels then;
- for each pivot point it searches all pivot po

MathSpecialFunctionsConvolve1DLibrary "MathSpecialFunctionsConvolve1D"
Convolution is one of the most important mathematical operations used in signal processing. This simple mathematical operation pops up in many scientific and industrial applications, from its use in a billion-layer large CNN to simple image denoising.
___

ErrorFunctionsLibrary "ErrorFunctions"
A collection of functions used to approximate the area beneath a Gaussian curve.
Because an ERF (Error Function) is an integral, there is no closed-form solution to calculating the area beneath the curve. Meaning all ERFs are approximations; precisely wrong, but mostly a

Trend Volatility Index (TVI)Trend Volatility Index (TVI)
A robust nonparametric oscillator for structural trend volatility detection
⸻
What is this?
TVI is a volatility oscillator designed to measure the strength and emergence of price trends using nonparametric statistics.
It calculates a U-statistic based on the Gini mea

Cointegration Heatmap & Spread Table [EdgeTerminal]The Cointegration Heatmap is a powerful visual and quantitative tool designed to uncover deep, statistically meaningful relationships between assets.
Unlike traditional indicators that react to price movement, this tool analyzes the underlying statistical relationship between two time series and

See all indicators and strategies
News didn't load
Looks like that didn't go very well. Let's try again.
Community trends
WC: 29.80 Target: 1800-2400 MOASS: 47k-100K: Time to FOCUSAs I reminded everyone in the youtube video earlier this week we are dealing with a large Diagonal structure in GME
There is nothing unusual AT ALL about the decline we saw this week
That is the nature of diagonals
Now we seem to be bottoming again around 30 which if that continues should see pri

TslaFirst off.. that weekly candle was horrendous
Rising wedge here.. you can see it on the rsi as well
The target of this rising wedge is 300 or daily 200sma..
Lets see how wed get there..
We would need to break below 330.00.
351-355 will be strong resistance if you see a test up in that are

NVDA 4-hr Outlook1. Swept Weekly High with draw back into 4-hr gap up.
2. If price breaks below here, my target becomes the re-test of the 4-hr break due to the impulse move through that high.
a. WARNING: Need to watch for support on Weekly FVG and CE of 4-hr wick and support off .382 fib.
b. If target breaks below,

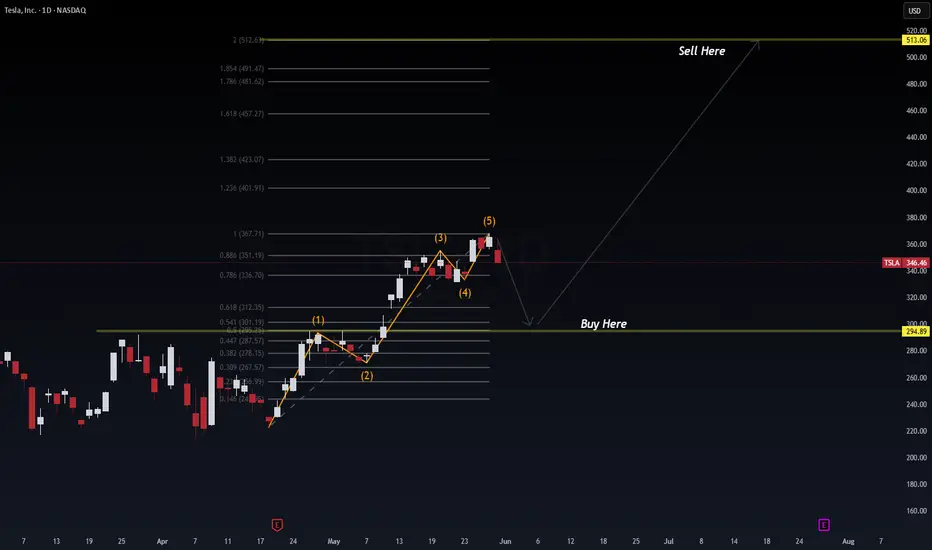
TSLA (Tesla) – Elliott Wave Impulse Ending + Fibonacci CorrectioTesla completed a textbook 5-wave Elliott impulse to the upside, topping out near the 1.0 Fibonacci extension ($367.71). We're now seeing signs of a corrective wave likely targeting the golden zone near $294.89 — aligning with SPY/NVDA retracements.
🔍 Elliott Wave Count:
Wave (1): Impulse from brea
NVDA looks to go downNVDA is not maintained its support level of 138.24 and its expect to fall support level of 129.12. Wait for fresh entry it it fall to 129.12 or rise to 138.24.
Note: This is not a buy/sell trade call.

UNH LONGOh man, what a chart to dig into.
(Read the fundamental analysis for this one—I don’t look into company financials or earnings. I’m also not following the news, so that’s on you. I’ve seen too many setups fail because of some unexpected headline or a random tweet on a f***ing Monday from the orange

GOOGL JUN 2025 GOOGL Technical Analysis (May 31, 2025)
GOOGL remains in a bullish trend with key upside targets:
Main target: 185 (gap resistance)
Intermediate resistance: 180
Immediate support at 170 (distribution zone)
Critical support: 160 (stop-loss level)
If 160 breaks, next key supports are at 150, 14

AMD breaking outAMD entered the 96 to 115 box like a rocket, and it is now showing a lot of strength after being dormant for a while.
The conditions are now there for a gradual run-up towards the 172 level. If it comes back below the 96 mark, I would argue that the movement has aborted.

AAPL breakout coming soonWhich way will it squeeze? I share my thoughts if AAPL can hold above 200.
*technically showing caution signs (bearish, but can flip)
*news is affecting the market greatly (esp AAPL re: tarriffs)
*RSI & MACD need a positive signal
*204, 205, 208 immediate targets to be focused on imo
Have a great

$1 to $4+ or 300% vertical on $BMGL todayPower move!
Warned chat about huge buy blocks in mid $2's with Buy Alert following soon to take advantage of the move 🤑
Fresh Cash Friday ✅

See all stocks ideas
Tomorrow
CPBThe Campbell's Company
Actual
—
Estimate
0.65
USD
Tomorrow
CRMTAmerica's Car-Mart, Inc.
Actual
—
Estimate
0.86
USD
Tomorrow
GESGuess?, Inc.
Actual
—
Estimate
−0.69
USD
Tomorrow
PODCPodcastOne, Inc.
Actual
—
Estimate
−0.04
USD
Tomorrow
SAICScience Applications International Corporation
Actual
—
Estimate
2.12
USD
Tomorrow
CRDOCredo Technology Group Holding Ltd
Actual
—
Estimate
0.27
USD
Jun 3
DCIDonaldson Company, Inc.
Actual
—
Estimate
0.95
USD
Jun 3
FERGFerguson Enterprises Inc.
Actual
—
Estimate
2.01
USD
See more events
News didn't load
Looks like that didn't go very well. Let's try again.
Community trends
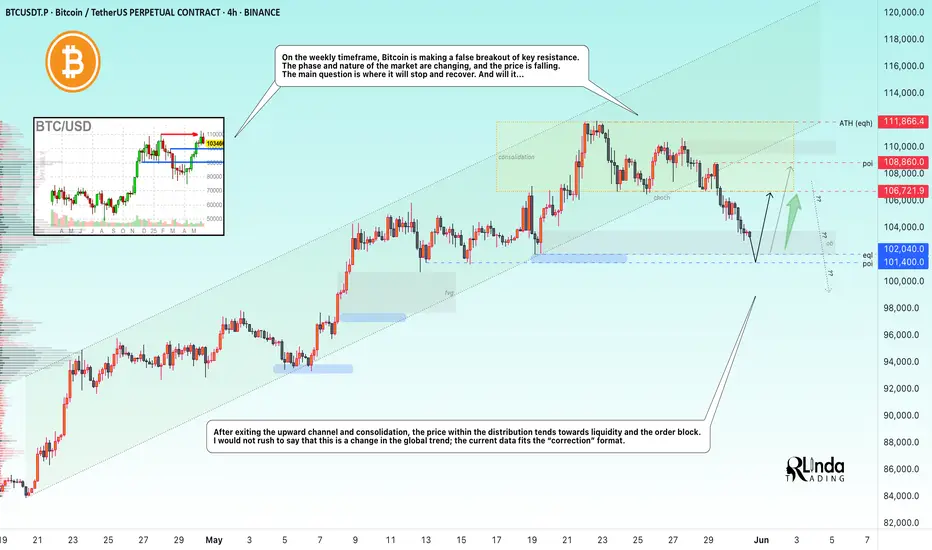
BITCOIN → Correction or trend reversal? Why is 101K important?BINANCE:BTCUSDT.P is exiting the upward channel after a false breakout of the key resistance level of 110K (previous ATH). Liquidation?
Quite an interesting situation with James Wynn. As they say, money loves silence, especially when it comes to a highly manipulated market... A week after the
TradeCityPro | Comprehensive Bitcoin Analysis for 2025👋 Welcome to TradeCityPro Channel!
Let's go for the most complete BINANCE:BTCUSDT Bitcoin analysis you can see. In this analysis, we are going to examine the data from monthly to weekly to daily time frames and more in the most complete way possible!
🌐 Monthly Timeframe
In the monthly timefr

Lingrid | DOGEUSDT Corrective Move Completed. Possible LongThe price perfectly fulfilled my last idea . BINANCE:DOGEUSDT just printed a higher low on the ascending channel support, bouncing off the 0.188–0.190 zone. The prior A-B-C pullback is fading, and early bullish signals are showing above 0.192. If buyers regain control, the price could target 0.2

Bitcoin – Entering a distribution phase after a bull trap?Since the second week of May, Bitcoin (BTC) has exhibited a textbook accumulation phase, with a well-defined trading range forming just below the previous all-time high. Beginning around May 12, price action became increasingly compressed, marked by a series of higher lows and relatively flat resist

MOONPIG Is Taking Off — Thanks to James Wynn’s Viral CloutThe James Wynn Phenomenon:
James Wynn, a crypto trader who turned $4 million into $100 million before losing nearly all of it in leveraged Bitcoin futures, has become a polarizing figure in the crypto space. His massive trades, including a $1.2 billion Bitcoin long position that ended in a $17.5 mil

Bitcoin Mixed: Below Resistance, Above Support (Altcoins Update)I hope you are having a good Saturday and weekend my dear friend, I have a quick update on Bitcoin and the Altcoins market today. Good news and bad news.
Let's start with the good news.
The Altcoins are producing a higher low and bullish. This means that we will continue to see growth as expected.

Bitcoin Correction or Trap? Watch This Support Zone CloselyExclusive #Bitcoin Update
I got lots of DMs, people are asking:
Do you think the bull trend is finished, or is it just a correction and pullback?
Guys, first stop panicking.
This is exactly what the shark wants you to do. Don’t let them shake you out.
Let’s get to the chart:
My previous chart got

BTC Correction's 📉 Significant Bitcoin Correction During Uptrend
After a strong bullish rally, Bitcoin has entered a correction phase, retracing nearly 25% of its recent gains. Interestingly, this correction aligns exactly with the 200-period moving average on the 4-hour chart, marking a potential key support level.

Neiroethusdt.p ShortI will short this coin if it goes to my marked zone ( manipulated zone ) and shows some bearish momentum i am going to enter in this trade.
DYOR
every thing is mentioned on chart

#BNBUSDT: A Major Bull Move Incoming $1000 Target! Binance coin is currently in consolidation phase, with no clear direction of where it will go. We consider two possible areas where it may reverse. Both of these areas have a chance to hit $1000, which we believe the price could head towards once reversed.
If you like our idea, please like and comm

See all crypto ideas
News didn't load
Looks like that didn't go very well. Let's try again.
XAUUSD Daily Outlook — Monday, June 2, 2025“Compression in Premium: Is Gold Building for the Drop?”
👋 traders — let’s prepare the battlefield.
Gold continues to range inside a tight compression box just under the May High. The current daily structure is showing clear signs of distribution inside premium, with multiple failed attempts to br

GOLD 1H CHART ROUTE MAP UPDATE & TRADING PLAN FOR THE WEEKHey Everyone,
Please see our updated 1h chart levels and targets for the coming week.
We are seeing price play between two weighted levels with a gap above at 3305 and a gap below at 3271. We will need to see ema5 cross and lock on either weighted level to determine the next range.
We will see le

XAUUSD Analysis Today: Technical and Order Flow !In this video I will be sharing my XAUUSD analysis today, by providing my complete technical and order flow analysis, so you can watch it to possibly improve your forex trading skillset. The video is structured in 3 parts, first I will be performing my complete technical analysis, then I will be mov

Analysis of gold trend next week, hope it will be helpful to youAnalysis of the Original Text: Drivers of Gold Price and Logic of Bull-Bear Game
I. Fed Policy Expectations: The Core Catalyst for Short-Term Volatility
1.The Game Between Internal Divergence and Market ExpectationsThe divergence within the Fed on the path of interest rate cuts reflects uncertaintie

HelenP. I Gold will drop to support level from pennant patternHi folks today I'm prepared for you Gold analytics. The chart started with a strong impulse move upward from the support zone around 3190 - 3205, where buyers stepped in and pushed the price aggressively higher. This bullish momentum continued until the price reached the trend line, which had previo

Will Gold drop to 3200 zone next week?🟡 1. What happened last week with Gold (XAUUSD)
Gold began last week by testing the 3350 resistance zone, hinting the end of the correction and the potential for an upside breakout.
However, in the following days, the market reversed aggressively, reaching as low as 3250 on Thursday — a drop of

XAUUSD Breakout LoadingThe XAUUSD 1H chart shows a symmetrical triangle forming, with strong support around the $3,280–$3,290 zone.
Price is consolidating above this key area, suggesting bullish pressure.
A breakout above the descending trendline could push gold toward $3,320 and potentially $3,360.
A breakdown below t

Gold volatility intensifies before PCE data is released!
On Friday (May 30), gold continued to fall to $3,293. The focus of the day is the US PCE data, which may cause large fluctuations. In the morning, gold prices were under pressure at the 3,300 mark as the US dollar rebounded slightly - gold is negatively correlated with the US dollar, and a stronger

Gold XAUUSD Weekly forecast 2-6 June 2025Observations:
Price has been respecting a clear descending trendline since late April, with multiple touches and rejections.
A significant supply zone around the 3,330 level aligns with the trendline resistance, increasing confluence for a potential reversal.
The market has formed lower highs consis
Is Gold Bullish ? or Bearish ? Are you going to buy Gold ? hold on then because the chart of 4-hour telling us a story of buy and sell. Market is in consolidation after a strong bullish move and trying to take below liquidity of major support 3040 – 3080 and i believe so this going to happen soon , further you can checkout the ch
See all futures ideas
News didn't load
Looks like that didn't go very well. Let's try again.
EURUSD - Bullish Continuation SetupEURUSD recently retraced into a key demand zone where a 4H Fair Value Gap (FVG) aligned perfectly with the golden pocket (between 61.8% and 65% Fibonacci levels). This confluence provided a high-probability setup for a bullish reaction. After testing this level, price rebounded sharply, confirming t

#GBPJPY: Buyers and Sellers Both Has Equal Chances! Hey there! So, GBPJPY is at a pivotal moment, and we might see a mix of buying and selling activity in the market. Since the bulls aren’t exactly sure what to do next, here’s what we think:
- The GBPJPY pair is having a tough time breaking through the 194 region. The Japanese yen (JPY) is holding s

EUR/USD CHART PATTERN.MY EUR/USD trade setup based on the 2-hour chart pattern:
🔻 Trade Type: Short (Sell)
Entry: 1.13500
Resistance (Invalidation / Strong Resistance): 1.14140
Targets:
🎯 Target 1: 1.11300
🎯 Target 2 (Final): 1.10675
⚖️ Risk-Reward Overview
Target Reward (pips) Risk (pips) R:R Ratio
1st Target 220

EUR/USD4H Bearish Trade Setup Supply Zone Rejection with 3:1 RRR🔷 Trend Overview
📈 Price was in a rising channel (trend line + support line).
❌ Channel broken on downside → potential trend reversal.
🟧 🔼 Supply Zone (Sell Area)
📍 Zone: 1.13707 – 1.14432
🟠 Price faced rejection here.
💡 Institutional selling likely in this zone.
🔥 This is the ideal short-ent

USDJPY Forecast for NFP Week | Price at a Critical Turning PointIn this video, I’m diving into the USDJPY setup ahead of a high-impact week filled with major economic news like the NFP, ADP Employment, and speeches from the BoJ Governor.
We’ll walk through the technical zones I’m watching, discuss potential buyer and seller reactions, and outline the key cataly

EUR/USD - H4 - Triangle Formation (31.05.2025)The EUR/USD pair on the H4 timeframe presents a recent Formation of a Triangle Pattern.
1. Wait for Breakout with Good Volume
2. Conformation in short Timeframe Must
🎁 Please hit the like button and
🎁 Leave a comment to support for My Post !
Fundamental Updates :
Dollar mixed on tariff unce

GBPJPY Potential UpsidesHey Traders, in the coming week we are monitoring GBPJPY for a buying opportunity around 193.300 zone, GBPJPY is trading in an uptrend and currently is in a correction phase in which it is approaching the trend at 193.300 support and resistance area.
Trade safe, Joe.

GBPUSD COT and Liquidity AnalysisHey what up traders welcome to the COT data and Liquidity report. It's always good to go with those who move the market here is what I see in their cards. I share my COT - order flow views every weekend.
🎯 Goal of this ideas is track order flow.
📍Please be aware that institutions report data to

EURUSD Under Pressure! SELL!
My dear friends,
Please, find my technical outlook for EURUSD below:
The instrument tests an important psychological level 1.1348
Bias - Bearish
Technical Indicators: Supper Trend gives a precise Bearish signal, while Pivot Point HL predicts price changes and potential reversals in the market

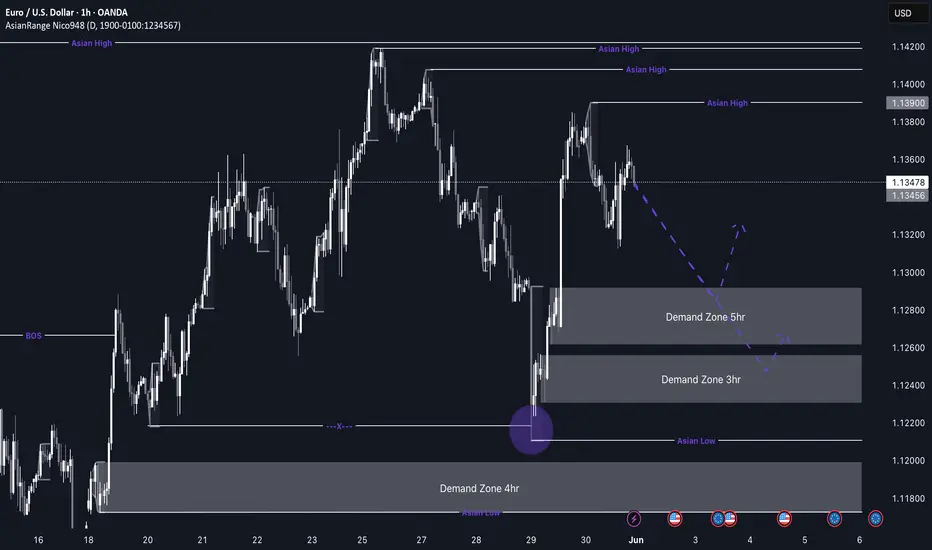
EUR/USD Potential longs to the upsideEU Weekly Outlook — Bullish Pro-Trend Setup in Focus
This week, my EU analysis is centered around the pro-trend movement to the upside. Price has recently broken structure and in doing so, has left behind clean demand zones on the 5H and 3H timeframes. I’ll be watching closely to see when price dec
See all forex ideas
| - | - | - | - | - | - | - | ||
| - | - | - | - | - | - | - | ||
| - | - | - | - | - | - | - | ||
| - | - | - | - | - | - | - | ||
| - | - | - | - | - | - | - | ||
| - | - | - | - | - | - | - | ||
| - | - | - | - | - | - | - | ||
| - | - | - | - | - | - | - |
News didn't load
Looks like that didn't go very well. Let's try again.
Trade directly on the supercharts through our supported, fully-verified and user-reviewed brokers.


