Gold long again: Completion of Double CombinationYesterday's long gold idea was invalidated and turns out that Gold has decided to do a double combination instead of a single A-B-C correction.
Now that I've seen a completion of a Double Combination, I think it is time to try to long gold again.
The stop is below $3240.

The best trades require research, then commitment.
Get started for free$0 forever, no credit card needed

Scott "Kidd" PoteetThe unlikely astronaut

Where the world does markets
Join 100 million traders and investors taking the future into their own hands.
Explore features
Is Bitcoin Ready for Its Next Leg Up? Here’s What We Know So FarBitcoin BITSTAMP:BTCUSD is so back — not just back like “we recovered the dip,” but back like “new all-time highs, let’s go shopping for Lambos on moons” back.
If you’ve been following our Top Stories coverage, you’ll know that the OG token vaulted past $109,500 last week, then kissed $11

USDJPY – Diverging Policies Drive Yen into Pressure Zone near 14USDJPY – Diverging Policies Drive Yen into Pressure Zone near 144
🌍 Macro Landscape: JPY Stuck Between Two Diverging Forces
In recent weeks, the US dollar has regained strength as the Federal Reserve remains committed to its "higher-for-longer" interest rate stance. On the flip side, the Bank of Jap

Trump Delays Tariffs, but Trade Tensions with EU Are Heating UpDonald Trump is back in headline mode — and this time, the EU is in his crosshairs.
After weeks of relative calm, the US President reignited global trade tensions by announcing a 50% tariff on all EU imports. But in a surprise twist — and in true reality-TV fashion — he’s now pushed the start date

SMR NNE OKLO – Breakout Setup Triggered by Nuclear CatalystNYSE:SMR is lighting up after Trump’s announcement on nuclear energy — and it’s not alone. NYSE:OKLO and NASDAQ:NNE are also setting up, but NYSE:SMR has one of the cleanest breakout structures on the board.
🔹 Catalyst: Trump’s nuclear energy announcement yesterday is putting serious momentu

GOLD Price Analysis: Key Insights for Next Week Trading DecisionGold prices surged last week, ending with a strong 3.9% weekly gain, closing around the $3,365 zone after bouncing back with conviction on Friday. In this video, I break down why gold rallied, what key events influenced price action, and how I’m reading the current chart structure to strategically p

Gold at a Crossroads: Key Resistance Levels in FocusFrom the Trading Desk of InvestmentLive:
Gold has struggled to sustain any meaningful downward momentum, despite our broader bearish bias on the yellow metal. After a sharp decline the week before, last week saw gold stage an even stronger recovery, pushing higher and regaining lost ground.
Howeve

Week of 5/25/25: EU AnalysisExtremely bullish last week leads to my bias being long this week until the weak daily structure is broken.
Thanks for coming, goodluck this week!
Major News:
PMI - Thursday

Quick updateSP500 and Gold both consolidating, not much action but I think we may see some movement overnight

Use a Top Down Approach to gather as much CONFLUENCE as possibleAll the information you need to find a high probability trade are in front of you on the charts so build your trading decisions on 'the facts' of the chart NOT what you think or what you want to happen or even what you heard will happen. If you have enough facts telling you to trade in a certain dir

See all editors' picks ideas
EMD Trend [InvestorUnknown]EMD Trend is a dynamic trend-following indicator that utilizes Exponential Moving Deviation (EMD) to build adaptive channels around a selected moving average. Designed for traders who value responsive trend signals with built-in volatility sensitivity, this tool highlights directional bias, market

Bear Market Probability Model# Bear Market Probability Model: A Multi-Factor Risk Assessment Framework
The Bear Market Probability Model represents a comprehensive quantitative framework for assessing systemic market risk through the integration of 13 distinct risk factors across four analytical categories: macroeconomic indic

Range Filter [DW]This is an experimental study designed to filter out minor price action for a clearer view of trends.
Inspired by the QQE's volatility filter, this filter applies the process directly to price rather than to a smoothed RSI.
First, a smooth average price range is calculated for the basis of the fil

Delta Volume Columns Pro [LucF]█ OVERVIEW
This indicator displays volume delta information calculated with intrabar inspection on historical bars, and feed updates when running in realtime. It is designed to run in a pane and can display either stacked buy/sell volume columns or a signal line which can be calculated and dis

BERLIN CandlesA problem with Heikin Ashi is that while it gives you a great overview of overall direction, it is rarely possible to use it as a replacement for normal japanese
candlesticks. The reason for this is that actual price data is lost, since the candles are more akin to a moving average than a different

Support Resistance ChannelsHello All,
For Long time I was planning to make Support/Resistance Channels script, finally I had time and here it is.
How this script works?
- it finds and keeps Pivot Points
- when it found a new Pivot Point it clears older S/R channels then;
- for each pivot point it searches all pivot po

MathSpecialFunctionsConvolve1DLibrary "MathSpecialFunctionsConvolve1D"
Convolution is one of the most important mathematical operations used in signal processing. This simple mathematical operation pops up in many scientific and industrial applications, from its use in a billion-layer large CNN to simple image denoising.
___

ErrorFunctionsLibrary "ErrorFunctions"
A collection of functions used to approximate the area beneath a Gaussian curve.
Because an ERF (Error Function) is an integral, there is no closed-form solution to calculating the area beneath the curve. Meaning all ERFs are approximations; precisely wrong, but mostly a

Trend Volatility Index (TVI)Trend Volatility Index (TVI)
A robust nonparametric oscillator for structural trend volatility detection
⸻
What is this?
TVI is a volatility oscillator designed to measure the strength and emergence of price trends using nonparametric statistics.
It calculates a U-statistic based on the Gini mea

Cointegration Heatmap & Spread Table [EdgeTerminal]The Cointegration Heatmap is a powerful visual and quantitative tool designed to uncover deep, statistically meaningful relationships between assets.
Unlike traditional indicators that react to price movement, this tool analyzes the underlying statistical relationship between two time series and

See all indicators and strategies
News didn't load
Looks like that didn't go very well. Let's try again.
Community trends
Meta Platforms - The rally is clearly not over!Meta Platforms - NASDAQ:META - can rally another +30%:
(click chart above to see the in depth analysis👆🏻)
Some people might say that it seem counterintuitive to predict another +30% rally on Meta Platforms while the stock has been rallying already about +750% over the past couple of months. Bu

AAPL 2025 Strategic Outlook: Overview of Primary CatalystsAfter trading around $200 intraday on May 27, Apple shares closed at $200.21—up 2.5% despite broad market headwinds and lingering investor skepticism.
Technical outlook remains bullish, as price action is still defined by
a rising bullish channel on higher time frames. expecting AAPL to bottom
out h

$NVDA - head and shoulders + possible bull shark harmonicOn my chart, NVDA appears to be potentially forming a head and shoulders pattern.
At the same time, an almost perfect bullish shark harmonic woukd comple around the target for the head and shoulders pattern.
Could be something, could be nothing.
But I'll be careful and not spend my money on NVDA

SHORT Tesla, Bearish Chart SetupGood morning my fellow Cryptocurrency trader, I hope you are having a wonderful day. If you decide to call me a genius or whatever... The choice is yours to make.
Here, the TSLA stock (Tesla) is showing some weakness signals. Weakness that can translate into a drop.
Would you like me to point thos

U Unity Potential Buyout Soon?!If you missed my previous signal on U (Unity):
Now Unity Technologies (NYSE: U) just caught fire — surging 12.5% in a single day — on a massive uptick in volume that should have every sharp trader watching closely. With $39.1M in volume against a daily average of 9.4M shares, something is clearly

GOOGLE Repeating 2024 pattern and eyes $197.00Alphabet Inc. (GOOG) has established a Channel Up pattern since the (near) 1W MA200 (orange trend-line) rebound. With the 1D MA50 (blue trend-line) now acting as a Support, this pattern resembles the Channel Up formations that emerged in 2024.
Both in terms of 1W RSI and pure price action alike, we

PALANTIR I Liquidity below 78 and OB. Target 160The liquidity cycle is not on, so I expect another pump will form soon.
Palantir Fundamentals in Brief
📍Innovative Tech & Diversified Base:
Palantir’s platforms—Foundry and Gotham—enable organizations to integrate and analyze large datasets, offering actionable insights. Their services span both

Xyz slight pull back and headed to 70s I’m seeing in the 2 H chart a candle outside the outer upper Bollinger, a divergence in the RSI which is pinned around 70, and The MACD also showing signs of a pullback. I believe this will kiss $59 of so and bounce further to mid 60s.

SOFI Long Setup – 2.83 Risk/RewardSOFI looks ready for a breakout. The price is consolidating just above the cloud after reclaiming the Kijun line. This setup offers solid upside if momentum follows through.
Entry: ~$13.46
Target: $16.37 (21.6% upside)
Stop: $12.43 (7.65% downside)
Risk/Reward: 2.83
Why I like this trade:
Clear su

$LCID Dips Today, Potential Rebound Toward $3.00 by JuneNASDAQ:LCID is down nearly 10% today. This could be a good opportunity, as recent price action suggests the stock has a solid chance to bounce back toward the $3.00 level by the end of June.

See all stocks ideas
Today
LASELaser Photonics Corporation
Actual
—
Estimate
—
Today
FPAYFlexShopper, Inc.
Actual
—
Estimate
0.03
USD
Today
THCHTH International Limited
Actual
—
Estimate
−0.26
USD
Today
LZMLifezone Metals Limited
Actual
—
Estimate
−0.12
USD
Today
PACSPACS Group, Inc.
Actual
—
Estimate
0.42
USD
Today
MANUManchester
Actual
—
Estimate
−0.33
USD
Today
NOVASunnova Energy International Inc.
Actual
—
Estimate
−0.89
USD
Today
CODID/B/A Compass Diversified Holdings Shares of Beneficial Interest
Actual
—
Estimate
0.46
USD
See more events
News didn't load
Looks like that didn't go very well. Let's try again.
Community trends
SHORT Bitcoin 10X Lev. Full PREMIUM Trade-Numbers (PP: 175.6%)For experts only. This is not for beginners.
Leveraged trading is ultra-high risk and it is even harder when it comes to shorting.
This is not medical advice. This is not spiritual advice.
This is definitely not financial advice. This is just a chart and some numbers.
How you decide to use these nu

WARNING! Sell Your Altcoins, -40% Drop AheadHello, Skyrexans!
The title of this article is made specially for haters. I see euphoria on each small drop of CRYPTOCAP:BTC.D and understand that altseason now will not happen. People are still holding and dreaming Lambos. This is very bad for potential growth, so I expect only dump on risky alt

Bitcoin - Will we go back to $99k?Bitcoin is showing its first real signs of weakness after an extended bullish run. The current price action around $106,700 suggests a loss of momentum, with price hovering just above a key daily low that could act as a pivot point. If this low gets taken out, it would likely mark a short-term shift

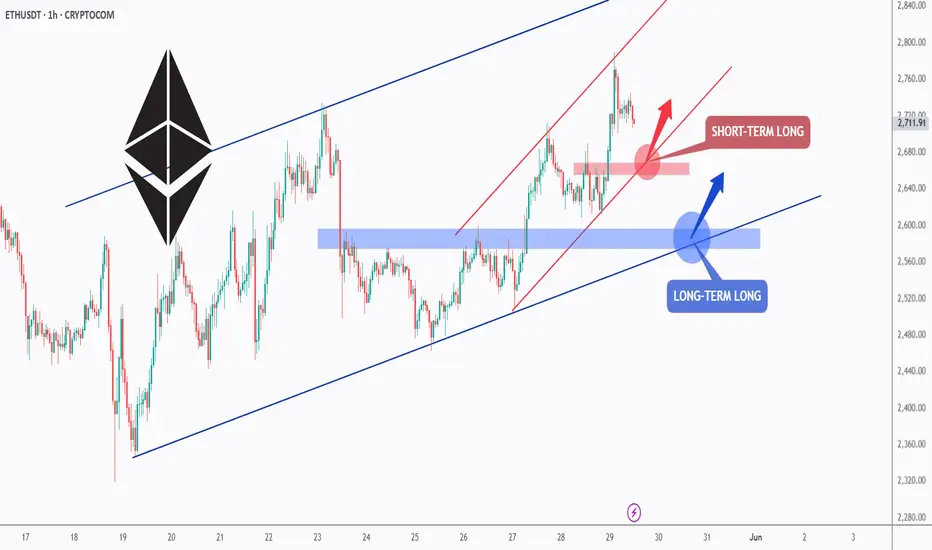
ETH - Long Anyway, Short-term and Long-term!Hello TradingView Family / Fellow Traders. This is Richard, also known as theSignalyst.
📈ETH has been overall bullish trading within the rising blue channel from a long-term perspective and within the rising red channel from a short-term perspective.
Moreover, the red and blue zones are strong s
BITCOIN Desperately needs that weekly closing!Bitcoin (BTCUSD) broke last week above its January Resistance, effectively making a new All Time High (ATH). Technically, within BTC's dominant 2.5-year Channel Up, that is not enough to generate a bullish extension on its own and the reason is that a 1W candle closing above the Resistance level is

Bitcoin is correcting to support. Possible growth to 110.000Bitcoin failed to hold above 110000, but at the same time the price is forming a flat. The support has not been tested yet (the cascade of orders below the level has not been touched) and within the uptrend the area of 106700 plays an important role.
Based on bitcoin is inside the flat you can consi

ETHUSD - Consolidation Zone Analysis | Watch $2700 Breakout📊 Ethereum (ETHUSD) is currently trading within a consolidation zone between key support at $2458 and resistance near $2720 on the 1H timeframe.
🔹 Breakout above $2700 could indicate potential bullish momentum continuation.
🔻 Breakdown below $2450 may suggest bearish sentiment gaining control.
T

AVAX/USDT Potential UpsidesHey Traders, in today's trading session we are monitoring AVAX/USDT for a buying opportunity around 22.00 zone, AVAX.USDT is trading in an uptrend and currently is in a correction phase in which it is approaching the trend at 22.00 support and resistance area.
Trade safe, Joe.

Bitcoin (BTC/USD) 1H Chart Analysis – Double Top Signals BearishPattern Formed: DOUBLE TOP
⚠️ Bearish Reversal Pattern Spotted!
📍 Formed near 111,794.8
⬆️ Price tested the top twice and failed – strong resistance confirmed!
Key Zones:
🔶 SUPPLY ZONE (Resistance):
🟧 111,794.8 - 111,829.8
🔼 Expect selling pressure here!
🔷 SUPPORT Zone (Broken!):
🔻 Price fell be


See all crypto ideas
News didn't load
Looks like that didn't go very well. Let's try again.
GOLD increased in the short term, approaching an important levelFrom a recent price action standpoint, the move on Gold may have offered cues of encountering weakness, and could serve as a key trigger for bearish traders. This is why I’m anticipating further short-side follow-through. The negative outlook is not confirmed yet, however a bounce off the trendline

Gold at Key Rejection Zone: Will the Drop Resume from $3310?By examining the gold chart on the 4-hour timeframe, we can see that after some consolidation between $3294 and $3302, the price finally began a sharp drop, correcting down to $3245. This area was a key demand zone on lower timeframes, which triggered a rebound, and gold is now trading around $3310.

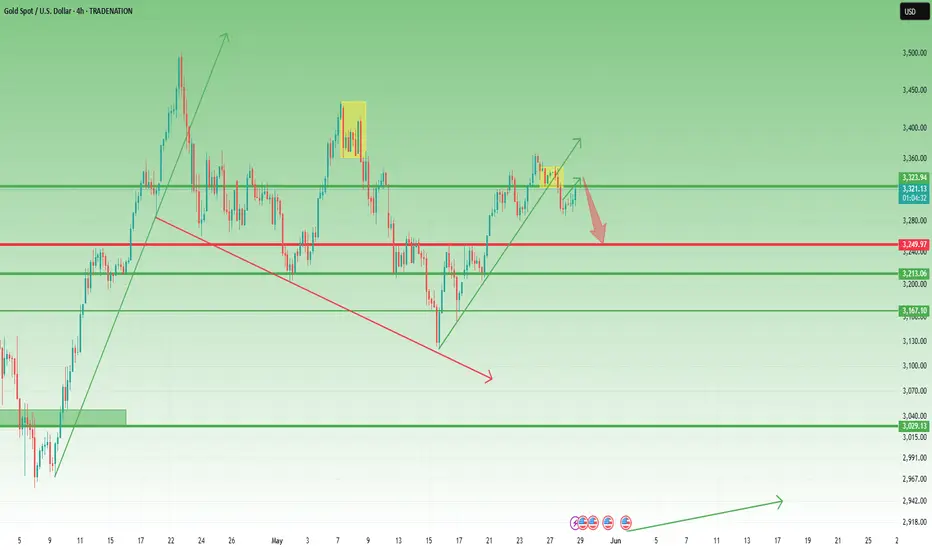
Gold long again: Completion of Double CombinationYesterday's long gold idea was invalidated and turns out that Gold has decided to do a double combination instead of a single A-B-C correction.
Now that I've seen a completion of a Double Combination, I think it is time to try to long gold again.
The stop is below $3240.
XAU/USD) 3 top technical analysis Read The ChaptianSMC trading point update
Technical analysis (XAU/USD) on a 4-hour timeframe, with key elements and potential price scenarios illustrated. Here's a breakdown of the idea behind this analysis:
---
1. Key Levels and Zones
Resistance Zone (~3,320–3,330):
Marked with red arrows indicating multi

Lingrid | GOLD potential LONG trade From the SWAP zoneOANDA:XAUUSD is testing the SWAP zone, aligning closely with the rising trendline support near 3244. If bulls defend this level again, a move toward 3400 remains in play, with the downtrend line offering resistance on the way up. A higher low formation here would signal renewed bullish interest. We

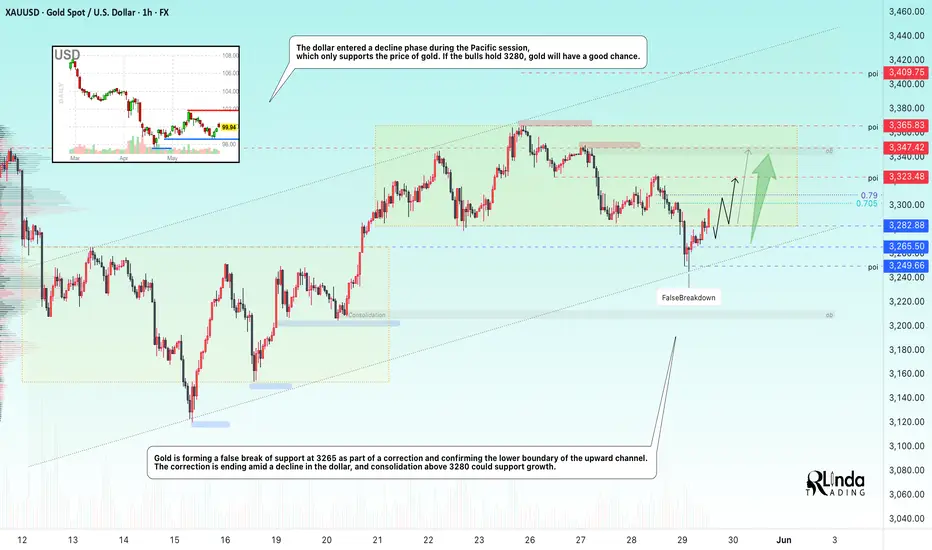
GOLD → False breakdown and support from the falling DXYFX:XAUUSD , as part of a correction, confirms the upward trend line and returns to the consolidation (range), making a false breakdown of support amid the dollar's correction...
The US dollar remains stable thanks to the Fed's hawkish minutes and the court's decision to block Trump's tariffs.
#XAUUSD[GOLD]: Massive Boost For Buyers, Incoming More Volume! Gold has been moving as expected in our previous chart. We anticipate a smooth bull market in the coming days, with a target price region of 3400$. There are three specific targets you can aim for.
If you’d like to contribute, here are a few ways you can help us:
- Like our ideas
- Comment on our

XAUUSD – Medium-Term Outlook Still BearishAs I explained in yesterday’s analysis, my medium-term bias for Gold turned bearish, and I expect the 3250 support zone to be reached. My current strategy remains to sell rallies.
As shown in the chart, after reaching the 3285 support level — the same area where Gold reversed last week — price has
THE KOG REPORT - UpdateEnd of day update from us here at KOG:
Hmm, didn't quiet go the way we wanted but we did say watch for a break either side if you're long. The break came downside and our 4H red box bounced price early session only to then complete the move we initially wanted. Not quiet a cigar but it worked in

GOLD: Z Wave in Progress - WXWXZ PatternGOLD: Z Wave in Progress - WXWXZ Pattern
GOLD: Z Wave in Progress Gold is currently developing the final leg of a complex WXYXZ pattern, with the Z wave taking shape.
Gold tends to rise unpredictably—even on days without major news or strong market volume, making this a hazardous trade.
FOMC Min

See all futures ideas
News didn't load
Looks like that didn't go very well. Let's try again.
GBP/USD Breakout (28.05.2025)The GBP/USD Pair on the M30 timeframe presents a Potential Selling Opportunity due to a recent Formation of a Breakout Pattern. This suggests a shift in momentum towards the downside in the coming hours.
Possible Short Trade:
Entry: Consider Entering A Short Position around Trendline Of The Pat

EUR/USD) breakout Analysis Read The ChaptianSMC trading point update
Technical analysis for EUR/USD (Euro/US Dollar) on a 3-hour timeframe presents a bearish outlook. Here's a breakdown of the key ideas and elements in the analysis:
---
1. Breakdown of Rising Channel
Ascending Channel: Price was moving upward within a clearly defined

29.05.25 Morning ForecastPairs on Watch -
FX:AUDCAD
FX:EURUSD
TVC:USOIL
FX:GBPJPY
A short overview of the instruments I am looking at for today, multi-timeframe analysis down to what I will be looking at for an entry. Enjoy!

Hellena | EUR/USD (4H): LONG to the resistance area 1.15691.Colleagues, I believe that wave “5” of higher order has actively started an upward movement.
At the moment I see movement in wave “1” of medium order and it means that a correction in wave “2” to the area of 50% Fibonacci level (1.12434) is expected. But I would still advise to consider only upward

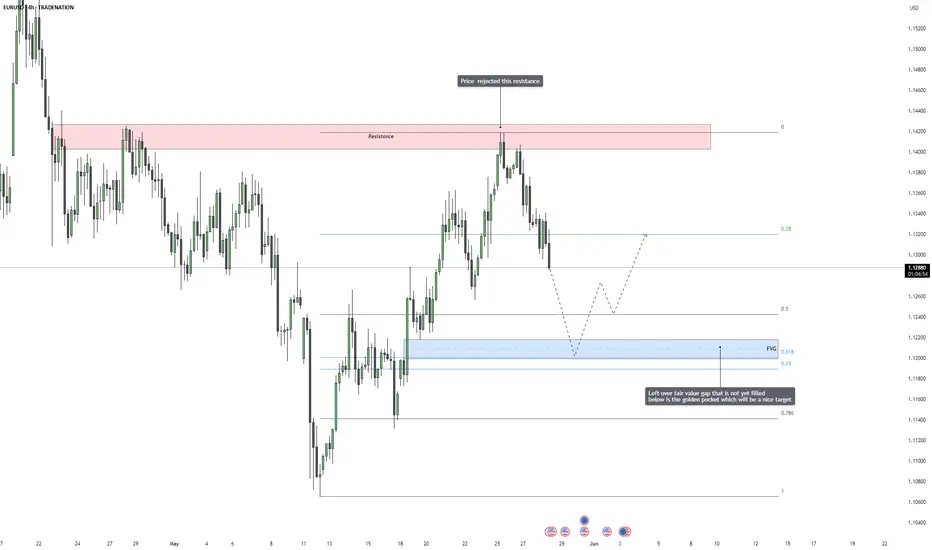
EURUSD – Bearish Reversal in Motion, Fair Value Gap Draws Price EURUSD has recently reacted strongly to a major resistance zone, where price previously stalled and reversed in the past. After running into this area again, we saw a sharp and immediate rejection, which confirms the presence of aggressive selling pressure. This rejection was not just a weak pullbac
EURUSD I Daily Weekly CLS I Model 1- 2R setupHey, Market Warriors, here is another outlook on this instrument
If you’ve been following me, you already know every setup you see is built around a CLS range, a Key Level, Liquidity and a specific execution model.
If you haven't followed me yet, start now.
My trading system is completely mech

USDJPY: Neutral View! One of The Hardest Forex Pair To TradeUSDJPY has not yet shown a clear move, ranging between 141 and 144. We are currently neutral as the price could go in either direction. Trade cautiously and manage risk according to your trade plan.
Thanks for your support! 😊
If you’d like to help us out, here are a few things you can do:
- Like

USDCAD Price Rebounding from Key Support as CAD WeakensUSDCAD is showing signs of a potential reversal from key support around the 1.3700–1.3685 zone. The pair had been declining steadily but recent weakness in the Canadian Dollar — driven by soft economic data and oil market uncertainty — is starting to shift momentum back in favor of the U.S. Dollar.

GBPUSD Analysis Today: Technical and Order Flow !In this video I will be sharing my GBPUSD analysis today, by providing my complete technical and order flow analysis, so you can watch it to possibly improve your forex trading skillset. The video is structured in 3 parts, first I will be performing my complete technical analysis, then I will be mov

GBP/JPY 4H Chart Analysis – Bullish Channel Setup📈 Trend:
Price is moving in an ascending channel
🔵 Support line below
🔴 Resistance line above
---
Key Zones & Levels:
📍 Demand Zone (Buy Area):
Between 191.753 – 194.016
Price might bounce here before continuing up
🔵 Likely pullback expected here
🎯 Target Point:
202.500
🚀 If price respe

See all forex ideas
| EUR | USD | GBP | JPY | AUD | CAD | |||
|---|---|---|---|---|---|---|---|---|
| EUR | - | - | - | - | - | - | - | |
| USD | - | - | - | - | - | - | - | |
| GBP | - | - | - | - | - | - | - | |
| JPY | - | - | - | - | - | - | - | |
| CHF | - | - | - | - | - | - | - | |
| AUD | - | - | - | - | - | - | - | |
| CNY | - | - | - | - | - | - | - | |
| CAD | - | - | - | - | - | - | - |
News didn't load
Looks like that didn't go very well. Let's try again.
Trade directly on the supercharts through our supported, fully-verified and user-reviewed brokers.


