


The TradingView Show with TradeStation: Bull Market or Fake Out?Join us for a timely TradingView live stream with David Russell, Head of Global Market Strategy at TradeStation, as we break down the latest rebound in the markets and what it could mean for traders and investors. In this session, we’ll dive into:
What the recent bounce off the lows might signal

/
The best trades require research, then commitment.
$0 forever, no credit card needed
Photo: Jimmy Chin ©
Where the world does markets
Join 100 million traders and investors taking the future into their own hands.

Tesla Stock Soars 60% in 4-Week Winning Streak. Should You Buy?With global trade tensions easing and the outlook clearing up a bit, especially with next month’s robotaxi launch, Tesla bulls are jumping right in to buy the dip and ride out a four-week rally. Is there more to that? Let’s find out.
Tesla NASDAQ:TSLA just pulled off a move most gym bros would ca

Tariff timeline: how Trump’s shifts hit the Nasdaq 100This chart tracks key US tariff decisions and rhetoric from February to May 2025 and their direct impact on the Nasdaq 100. It highlights the sharp escalation in tariffs against China and other trade partners, followed by market volatility and brief rebounds tied to policy softening. Notable events

GOLD - Bullish Trend Continuation w/ Bat Pattern & Complex PBGold has been on a tear for sometime now & well, you know what they say, all good things must come to an end. In saying end, we don't necessarily mean a forever end, but perhaps sometimes a break.
After failing to make a new high, it seems like Gold has reached it's excess or exhaustion phase & is

Will the USD Bears come back? Stock Market just pulling back?In this video I go over the EUR/USD, GBP/USD and USD/JPY. Will the USD bears come pouring back in or give up the previous low on the EUR/USD...
Some markers I'm watching is a "hidden" divergence on the MACD and it's potential signal for continued bullish strength for the EUR/USD, especially with th

SPY: short term pullback after credit downgrade? In this video we talk about what's next for the coming week in the S&P 500, given how we could be setting up for a short term pullback

BTC - New Impulse Soon!Hello TradingView Family / Fellow Traders. This is Richard, also known as theSignalyst.
📈 BTC has been bullish, trading within the rising channel marked in orange. 🟧
In a typical trend, corrections are usually bearish. 🔻
However, in BTC’s case, the correction phases marked in red are flat — a str

Gold Market Update: Bulls Still in Control?Gold Market Update: Bulls Still in Control?
Gold has been volatile, requiring close attention. Following our previous analysis, gold declined from its last bearish pattern, dropping from 3230 to 3120.
However, yesterday it rebounded sharply, surging from 3120 to 3251 despite the absence of any ne

Rare Platinum Setup Offers 7x Risk to RewardA breakout above 1000 in platinum could deliver a 7x risk to reward setup. In this short clip, we break down the technical pattern, timing, and trade plan.
This content is not directed to residents of the EU or UK. Any opinions, news, research, analyses, prices or other information contained on thi

Nvidia Overtakes Apple as 2nd-Biggest Company. Microsoft Next?Well, well, well — if it isn’t the GPU-maker-turned-global-tech-Goliath lapping the iPhone factory on the market cap leaderboard . Again.
Nvidia NASDAQ:NVDA has officially snatched the second-largest company title from Apple NASDAQ:AAPL , bringing its market cap north of $3.3 trillion, while Ap

See all editors' picks ideas
TASC 2025.06 Cybernetic Oscillator█ OVERVIEW
This script implements the Cybernetic Oscillator introduced by John F. Ehlers in his article "The Cybernetic Oscillator For More Flexibility, Making A Better Oscillator" from the June 2025 edition of the TASC Traders' Tips . It cascades two-pole highpass and lowpass filters, then sca

Dynamic Volume Clusters with Retest Signals (Zeiierman)█ Overview
The Dynamic Volume Clusters with Retest Signals indicator is designed to detect key Volume Clusters and provide Retest Signals. This tool is specifically engineered for traders looking to capitalize on volume-based trends, reversals, and key price retest points.
The indicator seamles

Multi-Layer Volume Profile [BigBeluga]A powerful multi-resolution volume analysis tool that stacks multiple profiles of historical trading activity to reveal true market structure.
This indicator breaks down total and delta volume distribution across time at four adjustable depths — enabling traders to spot major POCs, volume shelves,

pymath█ OVERVIEW
This library ➕ enhances Pine Script's built-in types (`float`, `int`, `array`, `array`) with mathematical methods, mirroring 🪞 many functions from Python's `math` module. Import this library to overload or add to built-in capabilities, enabling calls like `myFloat.sin()` or `myIntArra

Best SMA FinderThis script, Best SMA Finder, is a tool designed to identify the most robust simple moving average (SMA) length for a given chart, based on historical backtest performance. It evaluates hundreds of SMA values (from 10 to 1000) and selects the one that provides the best balance between profitability,

Bitcoin Monthly Seasonality [Alpha Extract]The Bitcoin Monthly Seasonality indicator analyzes historical Bitcoin price performance across different months of the year, enabling traders to identify seasonal patterns and potential trading opportunities. This tool helps traders:
Visualize which months historically perform best and worst for

Market Manipulation Index (MMI)The Composite Manipulation Index (CMI) is a structural integrity tool that quantifies how chaotic or orderly current market conditions are, with the aim of detecting potentially manipulated or unstable environments. It blends two distinct mathematical models that assess price behavior in terms of bo

Dual-Phase Trend Regime Oscillator (Zeiierman)█ Overview
Trend Regime: Dual-Phase Oscillator (Zeiierman) is a volatility-sensitive trend classification tool that dynamically switches between two oscillators, one optimized for low volatility, the other for high volatility.
By analyzing standard deviation-based volatility states and applying

Nasan Risk Score & Postion Size Estimator** THE RISK SCORE AND POSITION SIZE WILL ONLY BE CALCUTAED ON DIALY TIMEFRAME NOT IN OTHER TIMEFRAMES.
The typically accepted generic rule for risk management is not to risk more than 1% - 2 % of the capital in any given trade. It has its own basis however it does not take into account the stocks

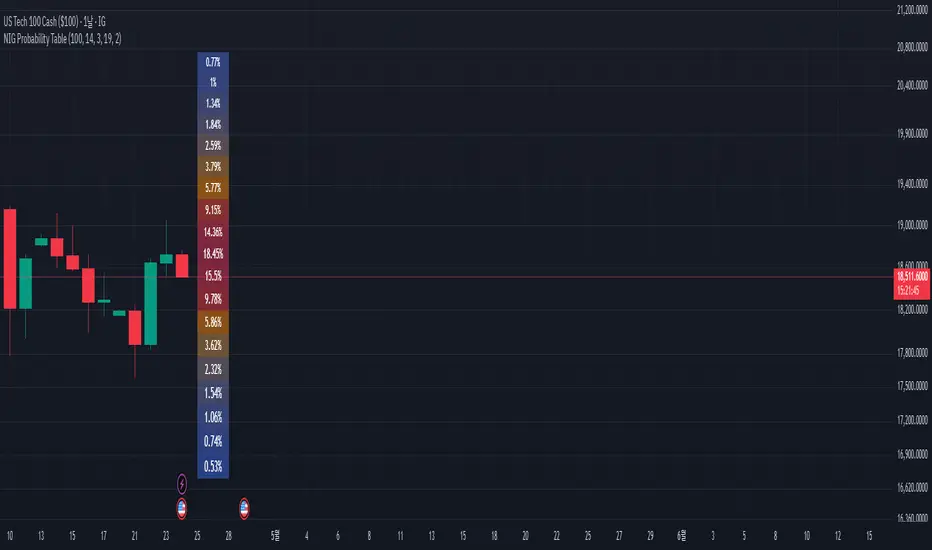
NIG Probability TableNormal-Inverse Gaussian Probability Table
This indicator implements the Normal-Inverse Gaussian (NIG) distribution to estimate the likelihood of future price based on recent market behavior.
📊 Key Features:
- Estimates the parameters (α: tail heaviness, β: skewness, δ: scale, μ: location)
of th
See all indicators and strategies
Community trends
Tesla Stock Soars 60% in 4-Week Winning Streak. Should You Buy?With global trade tensions easing and the outlook clearing up a bit, especially with next month’s robotaxi launch, Tesla bulls are jumping right in to buy the dip and ride out a four-week rally. Is there more to that? Let’s find out.
Tesla NASDAQ:TSLA just pulled off a move most gym bros would ca
WC: 28.45 Target: 1800-2400 MOASS: 47k-100K: Targets Acquired#GME20WeekCycle
NOTE: Recorded a Detailed Educational video on Targets but had a computer issue and lost it before it uploaded to Tradingview. Luckily Tradingview allows users to download videos before publishing them which I always immediately do in case of upload issues. Please check it out on m

Using Advanced Hybrid Leading Indicators for Swing Trading The professional side of the stock market has undergone massive infrastructural changes in the past 5 years. These changes are unknown to most retail traders and that can pose major problems for you success and profitability no matter what trading style you use.
A trading style is a type of trading

AMDWell, price made it into the box as I had forecasted. Is the pattern done for now to the upside? We cannot say yet, but if it does move higher, we should be looking to the 1.618 @ $126.16 for a reaction. I think another high to the 1.618 would fit great into the pattern after some slight consolidati

UNH: Short OTM puts expiring May 23UNH bounced from the $248.88 low and will probably not hit new low the following week. IV was relative high due to volatile stock price movement. Hence, setting up naked shorts on OTM puts.
Max potential profits: $1,000+ premiums on May 23
Exit strategy: buy back gradually if UNH price crosses dow

NVDA break 138.6 we will see the moonNVDA www.tradingview.com
support: 132.7 / resistance 135 / strong resistance at 138.6 (if we break through we will see the moon) - wish you make a lot of money. (this is a personal perspective, not advice)

Options Trade Idea: NVDA $135 PUT – Exp. May 23, 2025 -SwingI'm entering a NVDA $135 PUT expiring May 23, 2025, as a short-term swing trade based on my technical analysis.
Type: Put Option (ITM)
Strike Price: $135
Expiration: May 23, 2025 (this Friday)
Rationale:
I see signs of a potential downside move in NVDA: bearish RSI divergence, weakening momentum,

UNH - will lows be tested ?I opened Bear Put Spread on UnitedHealth Group Incorporated (UNH)
Expiration in 10 days. Risk-Reward-Ratio 1:10

LcidDriver Scenario (Possible):
• If the level holds above 2.58, stocks will likely continue towards 3.30-3.40.

Is $340 the next stop??Maybe we touch $342 as early as this week. It looks like it has the momentum to get there. All speculation so don’t get a bent out of shape. This is simply for fun. What are your thoughts??

See all stocks ideas
May 19
CBATCBAK Energy Technology, Inc.
Actual
−0.02
USD
Estimate
0.00
USD
May 19
THTarget Hospitality Corp.
Actual
−0.02
USD
Estimate
−0.02
USD
May 19
ZIMZIM Integrated Shipping Services Ltd.
Actual
2.45
USD
Estimate
1.87
USD
May 19
CGENCompugen Ltd.
Actual
−0.08
USD
Estimate
−0.06
USD
May 19
LNZALanzaTech Global, Inc.
Actual
−0.10
USD
Estimate
−0.15
USD
May 19
GILTGilat Satellite Networks Ltd.
Actual
0.03
USD
Estimate
0.06
USD
May 19
MESAMesa Air Group, Inc.
Actual
—
Estimate
—
May 19
GSLGlobal Ship Lease Inc New
Actual
2.65
USD
Estimate
2.33
USD
See more events
Community trends
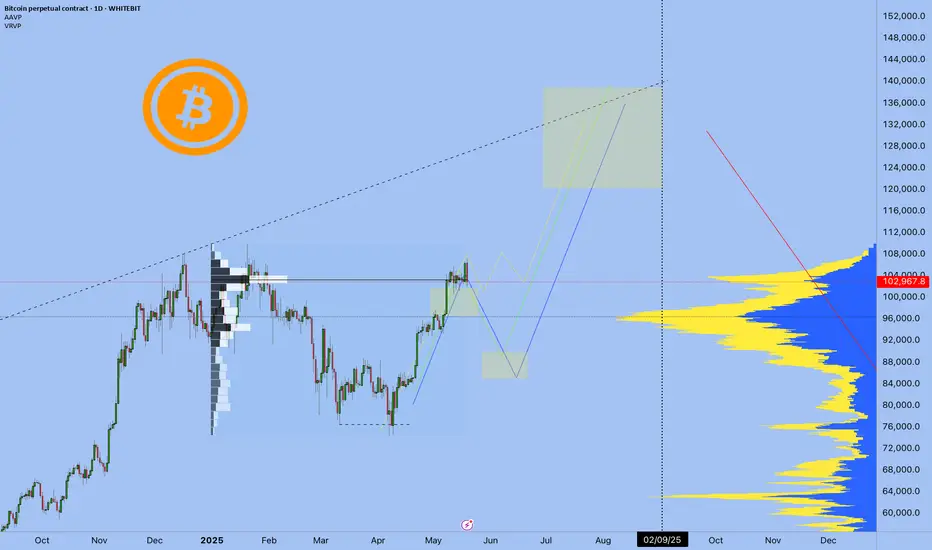
BTCUSD 19.05.2025 Bitcoin Navigator: BTC Update (May 2025)So the offline tournament is over, I took third place, and I just got back into work mode
In my previous publication ( link ), I outlined possible scenarios for Bitcoin’s price action, leaning towards a correction from around the $98-101k zone down to approximately $88k.
However, the current marke
Bitcoin - Dump and Pump to new ATH! Alt season summer 2025During summer, Bitcoin is usually very boring. You probably have heard of the sentence "Sell in May and go away." We can expect Bitcoin to go pretty much sideways in the next months, which creates a perfect environment for altcoins. But in the short term, Bitcoin is bullish and we are going to hit a

ETHUSD Break- Test- GO!!!This is a classic break-test go setup. What you want to see is a hook-down. What you don't want to see is push-back into the structure.
It's that simple.
Boost, like, follow, subscribe!

Altcoins: Bitcoin Daily Turns Bullish, New All-Time High But...New All-Time High but how high? How high is Bitcoin set to move in this breakout as a the new All-Time High? How high is Bitcoin set to continue in May that still has 12 days left and what about June and July 2025?
What happens after June-July 2025 and what happens in late 2025?
What's the map? How

Bitcoin: 106K Breakout To 113K Resistance.Bitcoin is attempting to break out of a minor consolidation which is a typical momentum continuation pattern. The updated wave count illustrates the potential (113K area) IF this breakout follows through over the coming week. While the structure is clearly bullish, I suspect this is a 5th of a 5th w

Bitcoin with or without some rest new ATH is ahead We are looking for new ATH asap.
But also we may have a short-term fall before that to supports like 100K$ or 93K$ first and then like green arrows pump for Bitcoin is ahead and market is now extremely bullish.
DISCLAIMER: ((trade based on your own decision))
<<press like👍 if you enjoy💚

Bitcoin can continue grow in channel, after small correctionHello traders, I want share with you my opinion about Bitcoin. In this chart, we can see how the price remains inside a clear upward channel, respecting both support and resistance boundaries. After breaking above the 93400 - 92400 support area, the price continued to grow and formed a new support z
HelenP. I Bitcoin can drop to $99500, breaking support levelHi folks today I'm prepared for you Bitcoin analytics. Price is currently testing a crucial area where multiple technical factors converge. After an extended period of consolidation between 101500 and 105100 points, the price failed to break the upper boundary and instead reversed, showing increased

BTCUSDT[BITCOIN]:Price is Likely to be Heading Towards $144,000.Recently, Bitcoin has shown extreme bullish price behaviour, and there’s no sign of bearish influence in the market. After monitoring the price since May 4th, we believe there’s a high possibility of price hitting the 120k region first. This could be followed by a small correction around 105k, where

BITCOIN → Consolidation in a triangle amid a BULLISH TRENDBINANCE:BTCUSDT is consolidating. A symmetrical triangle is forming against the backdrop of a bullish trend. Given the current technical nuances, we can bet that this consolidation is forming with the aim of continuing growth...
Fundamental nuances have gradually improved over the past few wee

See all crypto ideas
Lingrid | GOLD Weekly MARKET Outlook: From ATH to Range-BoundOANDA:XAUUSD market is currently in a critical consolidation phase following its all-time high level. The recent price action shows a significant pullback with a close below both the last 4 weeks' low and the previous higher low. This isn't necessarily a reversal but rather a structural shift towar

GOLD → Retest of trend resistance before declineFX:XAUUSD is recovering amid uncertainty, but there is a fairly strong resistance zone ahead that could hold back growth and trigger a decline...
Since the opening of the session, the price has recovered slightly after a week-long decline. Growth is being held back by two-sided risks: on the o

XAU/USD..1h chart pattern..I'm planning a *buy trade on XAUUSD (Gold) from 3230 with a target at 3345*. Let's analyze this trade setup:
### *Trade Summary:*
- *Instrument:* XAUUSD (Gold vs. US Dollar)
- *Direction:* Buy (Long)
- *Entry Price:* 3230
- *Take Profit (Target):* 3345
- *Potential Profit:* *115 pips* (3345

19.05.25 Morning ForecastPairs on Watch -
FX:GBPJPY
FX:CADJPY
FOREXCOM:COFFEE
A short overview of the instruments I am looking at for today, multi-timeframe analysis down to what I will be looking at for an entry. Enjoy!

XAUUSD Bearish Setup with Key Entry, Stop Loss & Target LevelsEA GOLD MAN XAUUSD
Entry Point: $3,235.94
Stop Loss: $3,235.94 (above current price, suggesting a SELL trade)
Target Points:
EA Target Point (Downside): $2,974.71 (Short target)
EA Target Point (Upside): $3,505.03 (Long target — likely alternate scenario)
Resistance Level: $3,121.49
Nearby S

GOLD 4H CHART ROUTE MAP UPDATEHey Everyone,
Great start tot he week with all our chart ideas playing out as analysed. This is an update on our 4H chart idea.
We began the week hitting our bullish target at 3235. Moving forward, we will monitor for a confirmed EMA5 cross and lock above 3235 to validate a potential move toward t

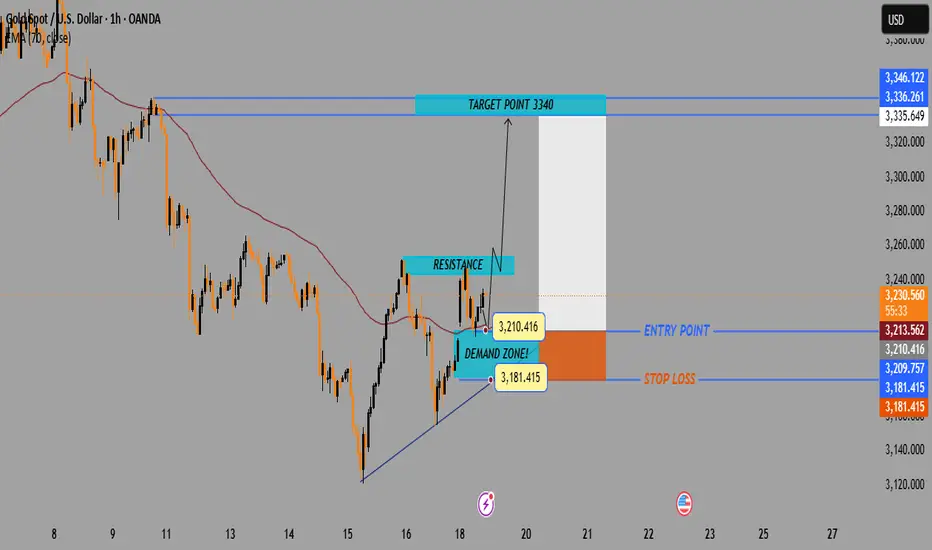
Gold 1-Hour Breakout Play • 3 210 3 340 • R : R 1 : 4🔍 Quick Chart Take
* 📉 Overall trend: down (still under the 200-MA)
* 🔺 Pattern forming: ascending triangle / wedge ➡️ potential breakout
📦 Zones
* 🟢 Demand / Entry: 3 181 – 3 210
* 🚧 Resistance cap: 3 235 – 3 250
* 🎯 Target: 3 340
⚔️ Trade idea
* ✨ Long at 3 210
* 🛑 Stop-loss 3 181
* 🏆 Take-profi
Gold Market Update: Bulls Still in Control?Gold Market Update: Bulls Still in Control?
Gold has been volatile, requiring close attention. Following our previous analysis, gold declined from its last bearish pattern, dropping from 3230 to 3120.
However, yesterday it rebounded sharply, surging from 3120 to 3251 despite the absence of any ne
THE KOG REPORT - UpdateEnd of day update from us here at KOG:
A very choppy day on gold today making it difficult to hold trades into the extreme levels. The range is smaller than usual and accumulation is in progress, so we will say please play defence on the markets.
We wanted lower to go higher, the red box broke

Trading around 3200 at the beginning of the week⭐️GOLDEN INFORMATION:
Gold (XAU/USD) is staging a recovery from recent losses, trading around $3,230 per troy ounce during Monday’s Asian session, as investors seek refuge in safe-haven assets amid growing anxiety over the US economic outlook and fiscal sustainability.
The rebound comes on the hee

See all futures ideas
GBP/CAD - Triangle Breakout (19.05.2025)The GBP/CAD pair on the M30 timeframe presents a Potential Buying Opportunity due to a recent Formation of a Triangle Pattern. This suggests a shift in momentum towards the upside and a higher likelihood of further advances in the coming hours.
Possible Long Trade:
Entry: Consider Entering A Long

EURUSD Could Start a New TrendEURUSD Could Start a New Trend
EURUSD broke out the neckline of a large Head and Shoulders pattern, indicating that a bigger bearish wave may happen soon.
The Head and shoulder pattern is a reversal formation that shows a possible change in trend.
EURUSD on the other hand is not taking a clear di

EURUSD – CME Gap and 0.786 Fib Align at Key Demand ZoneEURUSD has been trading with a strong bullish tone recently, breaking through previous resistance levels with conviction. However, after the latest impulse move to the upside, the market is now showing signs of exhaustion. Price has begun to pull back in a controlled manner, creating a potential opp

GBP/JPY) bullish trend analysis Read The ChaptianSMC trading point update
Technical analysis setup for the GBP/JPY pair on a 4-hour timeframe. Here's the breakdown of the trading idea:
---
Key Concepts Highlighted:
1. Support Trend Level (Yellow Zone):
The yellow zone marks a strong confluence area:
Horizontal support from previous price

EURUSD: Pullback From Resistance ConfirmedThe EUR/USD appears to be bearish on the 4-hour chart after hitting a significant daily resistance level.
The price has broken below the neckline of a descending triangle pattern and closed below it.
Suggesting a potential further decline. The next support level is at 1.108.

GBPUSD COT and Liquidity AnalysisCOT Report Analysis:
We can see longs coming to the markets. But don't fall for the trap yet. They accumulate for
weeks. We will see, most likely at least one more down week, where they will be closing shorts and adding more long positions.
Hey, what up traders, another week, another COT data and

GBPJPY Signal : 1H / 4H Beautiful buy !!!Hello Traders! 👋
What are your thoughts on GBPJPY ?
Symbol : GBPJPY H1
Market price : 193.20
BUY limit : 192.40 - 192.00
Tp1 :193.40
Tp2 : 194.60
Tp3 : 196.40
Tp4 : 199.60
Sl : 190.80
Don’t forget to like and share your thoughts in the comments! ❤️
Remember this is a position that was

GBPUSD may correct after false breakout The currency pair has overcome a huge 0.8% or 110 points since the opening of the session, having wasted all the potential and is trying to test the resistance. The potential for breakout and continuation of growth may not be enough and the price may make a false breakout and correction before the s

GBPJPY: Will Price Touch a Major Psychological Point Of 200? The GBPJPY currency pair is currently struggling to break through the 194 region as the Japanese yen (JPY) consolidates, making the future price trajectory uncertain. This situation has significantly complicated trading JPY pairs.
Analysing historical price behaviour in similar circumstances can pr

EURO - Price can make small correction and then bounce upHi guys, this is my overview for EURO, feel free to check it and write your feedback in comments👊
Recently, price entered to falling channel, where it at once fell to $1.1330 level and then not long time traded near this level.
Next, price rose to resistance line of channel, and some time traded n

See all forex ideas
| EUR | USD | GBP | JPY | CAD | ||||
|---|---|---|---|---|---|---|---|---|
| EUR | - | - | - | - | - | - | - | |
| USD | - | - | - | - | - | - | - | |
| GBP | - | - | - | - | - | - | - | |
| JPY | - | - | - | - | - | - | - | |
| CHF | - | - | - | - | - | - | - | |
| AUD | - | - | - | - | - | - | - | |
| CNY | - | - | - | - | - | - | - | |
| CAD | - | - | - | - | - | - | - |
Trade directly on the supercharts through our supported, fully-verified and user-reviewed brokers.


